


The print-on-demand industry continues to expand at a remarkable pace, creating new opportunities for entrepreneurs, e-commerce brands, and creators selling personalized products. As more consumers look for custom products and businesses adopt inventory-free selling models, the market is attracting increasing attention from researchers and investors alike.
Several statistical data projects strong growth for 2026, although the exact market size varies because each research firm measures the print-on-demand market differently. Despite those differences, they all point to one clear trend. The industry is growing rapidly and shows no sign of slowing down.
The global print-on-demand market is estimated to be worth between $13.1 billion and $15.19 billion in 2026. The range reflects differences in how market research models define and measure print-on-demand activity.
One estimate (Grand View Research) values the market at $10.8 billion in 2025 and $13.1 billion in 2026. Under this forecast, worldwide revenue could reach $57.5 billion by 2033, representing a compound annual growth rate of 23.6% from 2026 to 2033.
A separate analysis places the market at $12.15 billion in 2025 before rising to $15.19 billion in 2026. It projects a total value of $46.43 billion by 2031, with a compound annual growth rate of 25.05% between 2026 and 2031.
Rapid market expansion also does not guarantee equal results across the industry. Apparel, home decor, marketplaces, independent stores, and individual sellers can grow at different rates. Product selection, pricing, design quality, audience demand, marketing costs, and fulfilment performance will still influence how much revenue a POD store generates.
North America remained the largest print on demand market in 2025, accounting for approximately 40.15% of global revenue. The United States continued to lead regional growth and is expected to remain a major contributor over the next decade.
Key statistics
| Metric | Figure |
| Share of global POD revenue in 2025 | 40.15% |
| US POD market size in 2025 | $3.04 billion |
| Projected US market size by 2033 | $15.55 billion |
| Forecast CAGR from 2026 to 2033 | 23% |
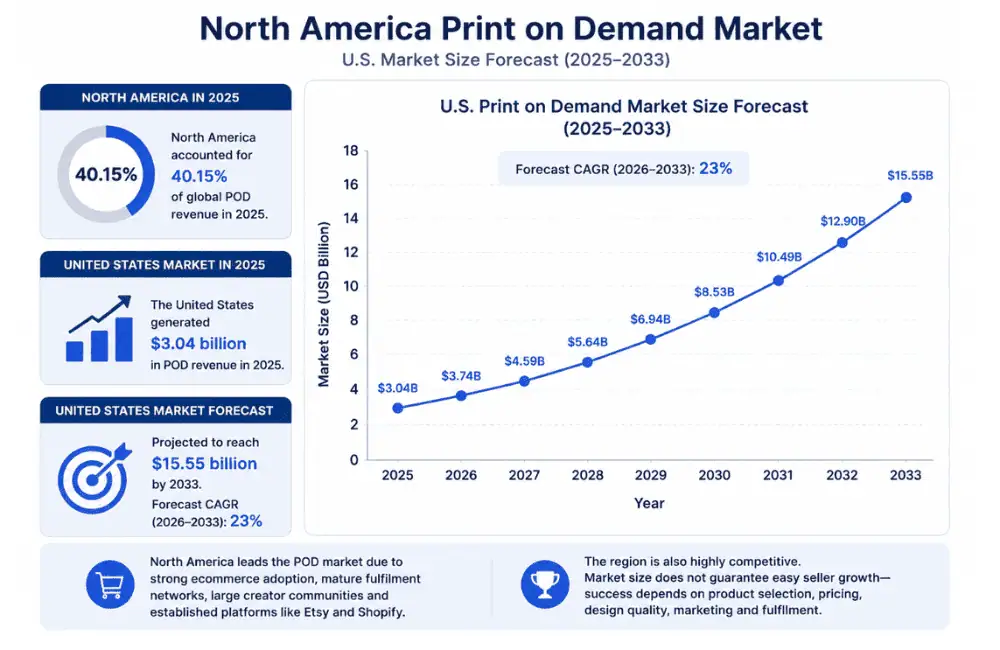
Several factors continue to support North America’s position as the largest print on demand market:
Although the region offers significant opportunities, it is also one of the most competitive markets. A growing market does not automatically translate into higher sales for every seller. Success still depends on choosing profitable products, creating distinctive designs, managing profit margins, and building a consistent marketing strategy.
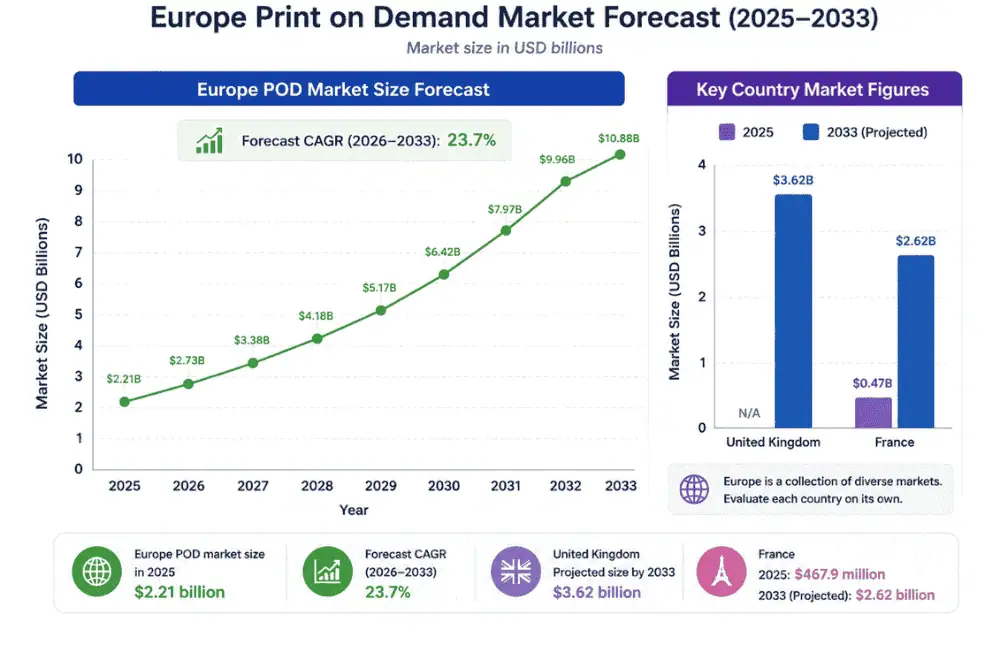
Unlike a single national market, Europe consists of countries with different languages, tax requirements, delivery expectations, and buying preferences.
The region generated approximately $2.21 billion in print-on-demand revenue in 2025 and is forecast to grow at about 23.7% annually from 2026 to 2033.
Country figures
Sellers should assess each country separately rather than treating Europe as one uniform market.
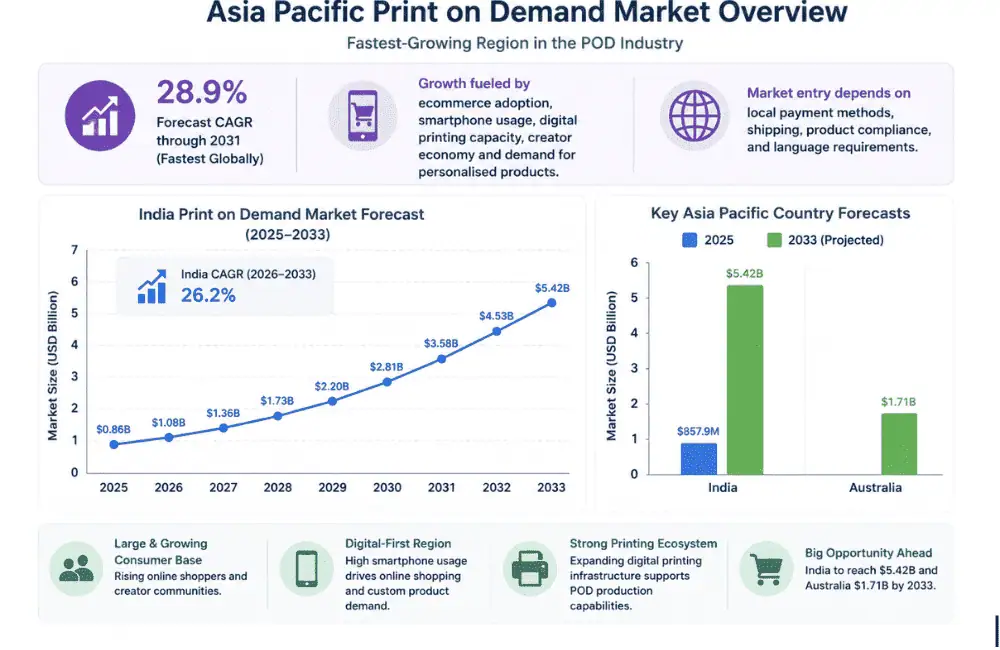
Asia Pacific is forecast to record the fastest regional growth, with an estimated 28.9% CAGR through 2031. Expanding e-commerce use, smartphone shopping, digital printing capacity, creator businesses, and demand for personalised products are supporting this growth.
Country figures
Market entry still depends on local payment options, shipping costs, product compliance, and language requirements.
Apparel held the largest share of the global print-on-demand market in 2025, accounting for 39.5% of total revenue. A separate industry statistic cited by Wix places apparel at approximately 37%, reflecting differences in the datasets and market definitions used.
Key apparel statistics
T-shirts, hoodies, and sweatshirts support much of this demand because they can be sold across creator merchandise, events, seasonal campaigns, brand collections, and niche communities.
The category’s leading revenue share does not mean every apparel seller earns higher profits. Competition, garment costs, sizing-related returns, print quality, and discounting can all reduce margins.
Home décor is forecast to grow at 26.74% annually through 2031, slightly faster than the 25.05% CAGR projected for the overall print-on-demand market.
Key figures
The category includes posters, canvas prints, framed art, cushions, blankets, personalised signs, and seasonal decorations. These products may support higher prices than basic apparel, although packaging, shipping size, breakage, and colour accuracy can affect margins.
For sellers managing large design catalogues, BulkMockup can apply multiple designs to Photoshop PSD mockups in batches, making it easier to show the same artwork across different frames, rooms, and product formats.
Online marketplaces remained the dominant sales channel for print-on-demand businesses in 2025, accounting for 59.72% of distribution channel revenue. This reflects the continued popularity of established e-commerce platforms where buyers actively search for personalised products.
Key statistics
Marketplaces such as Etsy and Amazon attract millions of shoppers every day, allowing sellers to reach existing demand without building their own audience from scratch. Built-in search, trusted checkout, and established payment systems also reduce the barriers to launching a new store.
Merchant-owned online stores are forecast to grow at a 25.9% compound annual growth rate through 2031, reflecting the increasing number of brands investing in their own ecommerce websites rather than relying entirely on third-party marketplaces.
Key statistics
Platforms such as Shopify, WooCommerce, and Wix give sellers greater control over:
The trade-off is that independent stores do not provide built in buyer traffic. Store owners are responsible for generating visitors through SEO, social media, paid advertising, email marketing, and other acquisition channels.
Etsy remains one of the largest marketplaces used by print-on-demand sellers, but its published figures describe the entire Etsy marketplace, not print-on-demand businesses alone. Etsy does not disclose how many sellers use POD providers such as Printify, Printful, or Gelato.
Key marketplace statistics
These figures highlight Etsy’s scale and continued importance for ecommerce sellers. At the same time, the decline in active buyers shows that even established marketplaces do not grow every year. Changes in buyer demand, competition, and marketplace policies can all influence seller performance.
Shopify merchants generated more than $100.7 billion in gross merchandise volume (GMV) during the first quarter of 2026, up from $74.75 billion in the first quarter of 2025. That represents an increase of nearly 35% year over year, highlighting continued growth across the platform.
Key statistics
These figures cover all merchants selling on Shopify, including fashion brands, electronics stores, beauty businesses, home goods retailers, and print-on-demand sellers. They should not be interpreted as print-on-demand revenue or the value of POD sales alone.
Some third-party reports claim that Shopify hosts 62.8% of all print-on-demand stores, but the underlying methodology is not publicly documented or independently verifiable. As a result, this figure should not be presented as an official Shopify statistic or treated as a reliable measure of the POD ecosystem.
Printify’s internal platform data provides a useful benchmark for how sellers on its platform perform. These figures represent Printify users only and should not be interpreted as averages for the entire print-on-demand industry.
Key statistics
These statistics show common patterns among successful Printify sellers, but they are not universal POD benchmarks. Reaching $1,000 in revenue is also different from earning $1,000 in profit, since production costs, shipping, advertising, marketplace fees, and taxes all reduce earnings.
Teemill reports that 74% of revenue generated by stores on its platform comes from mobile sessions. Desktops and other devices account for the remaining 26%.
Key statistics
These figures apply specifically to Teemill stores and should not be treated as an industry wide average. They still show why POD sellers should check mockup visibility, image cropping, text size, page speed, variant selection, and checkout usability on mobile.
Large catalogues also need consistent product images, but every exported mockup should be reviewed before publication.
The statistics throughout this guide point in one direction: successful print on demand businesses often expand their catalogues over time. More designs, products, colour options, marketplaces, and regional stores also mean thousands of additional product images to create and manage.
If your workflow already relies on Photoshop mockup templates, BulkMockup helps automate the repetitive work. It replaces smart objects across PSD files in batches while automatically resizing and aligning designs, supports multiple smart objects, generates organised file names and folders, and exports static images, animations, or videos from a single workflow.
Whether you run an Etsy shop, a Shopify store, a wall art business, or manage mockups for a larger POD team, BulkMockup helps you produce consistent mockups more efficiently. It will not create demand for your products, but it can make large scale mockup production far easier to manage.
Explore BulkMockup when manual mockup creation starts slowing down your catalogue growth.
The print on demand industry continues to show strong long term potential, with global market estimates placing its 2026 value between $13.1 billion and $15.19 billion. Most leading forecasts also project annual growth of about 24% to 25% over the coming years, although exact figures vary by research methodology.
The data also reveals important trends beyond market size. North America remains the largest regional market, Asia Pacific is expanding at the fastest pace, apparel continues to generate the highest revenue, home décor is gaining momentum, and online marketplaces remain the primary sales channel.
When evaluating these statistics, keep the context in mind. Global market forecasts, marketplace metrics, platform-specific data, and individual seller revenue measure different things. Most importantly, revenue should never be confused with profit.